26 Mar 2025
Data can be a strong tool that companies can use extensively for rapid growth. Data has the capacity to increase organizational performance, strategy formulation, and decision-making when used properly.
In a study conducted by a Business Intelligence Company found that 56% of respondents stated data analytics lead to “faster, more effective decision-making” at their companies. As we said earlier the key to success lies in data.
So, how do companies harness the power of data? The answer is Data Analytics. The majority of businesses constantly gather data, yet this data is meaningless in its unprocessed state. Above all what matters is how you use the data. Analyzing raw data to find patterns, trends, and insights that can provide valuable information about a specific business domain is known as data analytics.
Smart, data-driven decisions are then made using these insights. In this blog we have taken a deep dive into the various types of data analytics.
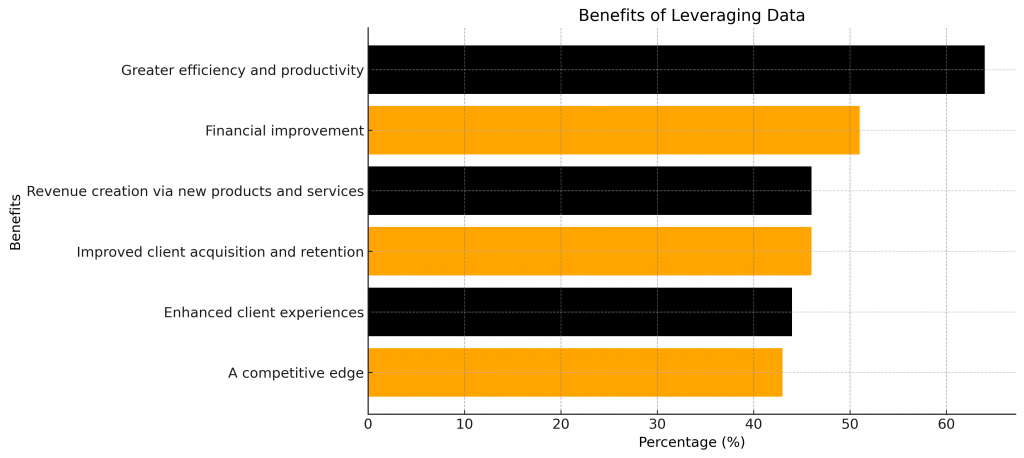
Table of Contents
What are Data analytics?
What is data analytics? Analyzing data to find trends, find answers, and draw conclusions is known as data analytics. When applied to business, data analytics is frequently referred to as business analytics.
Software, frameworks, and tools including Google Charts, Infogram, Tableau, Power BI, Microsoft Excel, and Zoho Analytics can be used to analyze data. These can assist you in analyzing data from many perspectives and producing visuals that shed light on the narrative you’re attempting to convey.
Data analytics also includes algorithms and machine learning, moreover it can collect, organize, and evaluate data more quickly and in greater quantities than people. Although writing algorithms is a more complex data analytics ability, you can still profit from data-driven decision-making without having extensive knowledge of statistical modeling and coding.
Who Needs Data Analytics?
Basic understanding of data analytics is essential for any business professional who takes judgments. Additionally data access is more widespread than before. You run the risk of missing important opportunities or warning signs that the data conveys if you develop plans and make choices without taking it into account.
The following professionals stand to gain from having data analytics skills:
- Firstly, marketers who design their ads using performance data from previous efforts, industry trends, and customer data.
- Secondly, product managers who examine user, market, and industry data to enhance their companies’ offerings.
- Thirdly finance specialists who estimate the financial paths of their organizations based on market trends and prior performance data.
- Lastly, professionals in human resources and diversity, equality, and inclusion who learn about the beliefs, drives, and actions of their workforce and combine that knowledge with statistics on market trends to implement significant changes inside their companies.

Types of Data Analytics -Statistics You Must Know
Data analytics is used by businesses to optimize profitability, optimize processes, and develop strategies. Organizations are working to make data the focal point of every significant division, from marketing and human resources to sales and finance, in order to remain competitive in the modern digital environment.
However, a company doesn’t become data-driven overnight. Data analytics has grown into a multibillion dollar industry that provides software, services, and also training to help businesses in all sectors as they work to become data-driven.
The following are the most recent data analytics trends and statistics:
- Projections indicate that the big data analytics market will reach $924.39 billion by 2032, reflecting a CAGR of 13%.
- 3 in 5 organizations are using data analytics to drive business innovation.
- The Analytics as a Service (AaaS) market is projected to reach $132.9 billion by 2032.
- Cloud computing is the top technology for companies investing in data and analytics.
Understanding The 4 Types Of Data Analytics
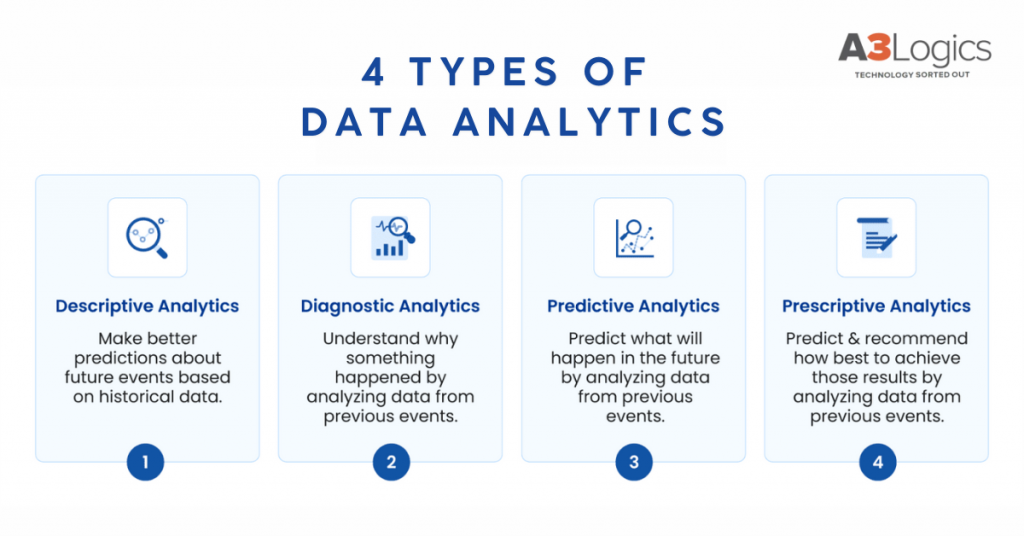
Data analytics is the act of studying data sets in order to reach conclusions regarding what the information therein contains. Therefore business uses it to enable organizations to make more informed decisions. Additionally Descriptive, Diagnostic, Predictive, and Prescriptive are four primary types of data analytics. Each of the 4 types of data analytics has a distinct function to reveal useful information.
1. Descriptive Analytics
> What is Descriptive Analytics?
Descriptive analytics is all about summarizing past data to know what has occurred in the past. It’s the backbone of business intelligence and allows organizations to have a general idea of trends, patterns, and outliers in their data.
> How Do You Start with Descriptive Analytics?
- To start with descriptive analytics, you need to:
- First collect historical data from various sources.
- Second clean and aggregate the data.
- Lastly, utilize software like Excel, SQL, or business intelligence tools (e.g., Tableau, Power BI) to produce reports and dashboards.
> How Descriptive Analytics Functions
It groups and displays raw data, turning it into readable summaries. Through the grouping of data into charts, tables, and graphs, it enables stakeholders to identify trends like sales growth, changes in website traffic, or changes in customer behavior.
> Descriptive Analytics Examples
- Monthly financial reports
- Website performance dashboards
- Sales trend analyses during a fiscal year
- Customer satisfaction survey reports
> Methods Employed in Descriptive Analytics
- Data aggregation: gathering and aggregating information from multiple sources.
- Data mining: pinpointing patterns in massive datasets.
- Simple statistical measures: mean, median, mode, and standard deviation.
- Reporting tools: dashboards and visualizations.
> Use Cases for Descriptive Analytics
- Monitoring key performance indicators (KPIs)
- Analysis of retail sales to determine customer purchasing habits
- Patient readmission rate monitoring for healthcare organizations
> Data Visualization in Descriptive Analytics
Visualization is essential in descriptive analytics. It converts raw information into easy-to-understand pictures such as pie charts, bar graphs, and line charts that enable decision-makers to quickly make sense of the insights.
2. Diagnostic Analytics
> What is Diagnostic Analytics?
Whereas descriptive analytics tells you “what happened,” diagnostic analytics goes further to tell you “why it happened.” As one of the 4 types of data analytics it helps to determine the underlying causes of trends, exceptions, or issues.
> How Do You Get Started with Diagnostic Analytics?
To begin with:
- First use drill-down techniques to decompose aggregated data.
- Second employ statistical techniques like correlation and regression analysis.
- Third use data discovery tools like SAS, R, or Python libraries (e.g., pandas, seaborn).
> How Diagnostic Analytics Works
It connects data relationships and patterns to underlying causes by:
- Comparing various variables.
- Discovering correlations.
- Testing hypothesis.
- Splitting data into subgroups.
> Diagnostic Analytics Use Cases
- Analyzing why sales declined in a particular region.
- Identifying reasons for high employee turnover.
- Identifying causes of increased customer churn.
> Diagnostic Analytics Examples
- Online shopping sites recognizing why a specific product category performed poorly.
- Telecom operators analyzing network outages by geography.
- Banks and other financial institutions knowing the reasons behind loan defaults.
3. Predictive Analytics
> What is Predictive Analytics?
Predictive analytics predicts future trends and outcomes using past data. Additionally it uses statistical models and machine learning methods to make educated guesses about what is likely to happen next.
> How Do You Get Started with Predictive Analytics?
Steps include:
- Collecting and preprocessing past and real-time data.
- Choosing appropriate predictive modeling methods (e.g., regression, decision trees, neural networks).
- Training and cross-validating models.
- Deploying models into business processes.
> How Predictive Analytics Works
Predictive analytics operates by feeding algorithms on historical data to produce models that are able to predict probable future events. Moreover it entails machine learning methodologies to iteratively improve predictions.
> Predictive Analytics Examples
- Projecting sales demand for the subsequent quarter.
- Modeling customer churn based on behavior data.
- Credit scoring models for banking.
- Forecasting equipment breakdowns in manufacturing (predictive maintenance).
> Machine Learning in Predictive Analytics
Machine learning is an essential area of predictive analytics. Through supervised and unsupervised learning algorithms, machine learning makes the process of pattern discovery automatic. Above all it enhances the accuracy of predictions with the passage of time.
4. Prescriptive Analytics
> What is Prescriptive Analytics?
Prescriptive analytics does not only forecast future consequences but also suggests particular steps that should be taken to produce desired outcomes. Moreover, it assists decision-makers in knowing what to do about predictions.
> How Do You Get Started with Prescriptive Analytics?
- Embed optimization models and simulation methods.
- You can utilize decision-support systems.
- Apply AI-based tools like reinforcement learning algorithms.
> How Prescriptive Analytics works?
Prescriptive analytics integrates historical data, business rules, machine learning, and simulations to provide actionable recommendations. Additionally it tends to utilize methods such as optimization modeling, scenario analysis, and constraint-based reasoning.
> Prescriptive Analytics Examples
- Supply chain optimization suggesting the optimal inventory levels.
- Personalized marketing campaigns aimed at specific customer segments.
- Dynamic pricing models for e-commerce.
- Route optimization in logistics and transportation.
Various Applications of the 4 Types of Data Analytics In Different Industries
Data analytics has a significant role to play in various industries. In this section we will take an in-depth look at the role of the various types of analytics in different industries.
Application of 4 Types of Data Analytics in Banking
1. Descriptive analytics in Banking
In the banking sector, descriptive analytics is widely used to monitor daily transaction patterns, helping institutions track common customer behaviors, such as frequent ATM withdrawals or peaks in online banking usage. Additionally by visualizing these trends, banks can gain a high-level understanding of customer preferences and financial activity.
2. Diagnostic analytics in Banking
Diagnostic analytics enables banks to investigate why certain financial patterns occur, such as a sudden increase in loan defaults or a dip in customer deposits. Moreover, it helps uncover the root causes behind service inefficiencies, such as long wait times or poor digital banking experiences, by analyzing customer complaints and feedback.
3. Predictive analytics in Banking
Predictive analytics plays a crucial role in forecasting future risks and opportunities. For example, banks leverage historical data to predict fraudulent transactions or identify customers who are most likely to default on loans. Additionally, predictive models can also forecast customer lifetime value, helping banks focus on high-value clients.
4. Prescriptive analytics in Banking
Finally, prescriptive analytics is used to recommend tailored investment portfolios to customers based on their financial goals and risk tolerance. It also helps banks optimize branch placement and ATM deployments by analyzing customer density and transaction volumes, improving both customer satisfaction and operational efficiency.
Application of the 4Types of Data Analytics in Healthcare
1. Descriptive analytics in Healthcare
In healthcare, descriptive analytics helps hospitals and healthcare organizations understand patient demographics, track admission and discharge rates, and analyze the prevalence of common conditions. Moreover these reports offer a comprehensive view of patient trends, treatment outcomes, and hospital performance.
2. Diagnostic analytics in Healthcare
Diagnostic analytics enables healthcare providers to uncover the causes behind critical issues, such as why readmission rates are high in a specific department or why certain patients experience adverse drug reactions. By segmenting patient data, healthcare professionals can identify patterns that contribute to negative outcomes.
3. Predictive analytics in Healthcare
With predictive analytics, healthcare providers can forecast disease outbreaks by analyzing seasonal data and patient records. Predictive models also help identify patients at risk of chronic conditions, such as heart disease or diabetes, allowing early interventions to improve patient care and reduce long-term costs.
4. Prescriptive analytics in Healthcare
Prescriptive analytics takes this a step further by recommending personalized treatment plans based on patient histories and predictive models. In addition it can also be used to optimize hospital resources, such as staffing schedules and operating room utilization, ensuring efficient operations and improved patient experiences.
Application of the 4Types of Data Analytics in Big Data and Data Science
1. Descriptive analytics Big Data and Data Science
In the world of big data and data science, descriptive analytics plays a foundational role in summarizing massive datasets to identify overarching trends and patterns. For example, it helps organizations make sense of petabytes of web traffic or system logs by providing insights into user behavior, website performance, and customer engagement.
2. Diagnostic analytics in Big Data and Data Science
Diagnostic analytics is then used to drill deeper into this data, identifying the root causes of anomalies or performance bottlenecks in applications or services. For instance, it can pinpoint why a website is experiencing sudden drops in traffic or uncover patterns behind system outages.
3. Predictive analytics in Big Data and Data Science
Predictive analytics is central to building models that forecast customer behavior, demand patterns, or potential risks. For example, data scientists use predictive techniques to power recommendation engines, customer churn models, and demand forecasting systems that help businesses make data-driven decisions.
4. Prescriptive analytics in Big Data and Data Science
Finally, prescriptive analytics helps organizations apply AI-powered optimization techniques to refine their processes. This includes dynamic pricing strategies, supply chain optimization, and personalized product recommendations. Additionally by combining predictive insights with prescriptive recommendations, businesses can enhance their decision-making and drive measurable outcomes.
Enhancing Data Analytics with Artificial Intelligence and Gen AI
Artificial Intelligence (AI) and Generative AI are revolutionizing data analytics by greatly enhancing the speed, accuracy, and scalability of analytical routines. Conventional data analytics is labor-intensive in terms of manual data gathering, cleaning, and modeling, however AI does the same processes with automatic intervention, doing away with the inefficiency of human involvement.
AI systems have the ability to ingest, preprocess, and analyze large datasets automatically in real-time, allowing quicker insights and decision-making.
One of the most significant contributions of AI is in predictive and prescriptive analytics, where machine learning and deep learning algorithms enhance the precision of predictions and recommendations.
AI models learn from past data continuously and update their outputs based on new data, making them extremely adaptive and able to create accurate predictions, like customer churn or demand volatility.
AI also augments prescriptive analytics by modeling various business scenarios and recommending best action according to constraints, goals, and past trends.
Generative AI, one of the subsets of AI, goes a step ahead of analytics by generating new data, insights, and even content from current datasets.
For instance, generative models are able to synthesize realistic customer profiles, create natural language reports, or build synthetic training data to enhance the performance of machine learning models.
This allows businesses to break past data constraints, accelerate experimentation, and enhance their datasets without needing to depend exclusively on real-world data.
AI and Generative AI also equip organizations with automated reporting and decision-support capabilities. AI systems are able to generate executive summaries, visualizations, and actionable recommendations automatically from large datasets, freeing up precious time for business leaders and analysts.
Additionally, AI-powered analytics platforms frequently feature natural language processing (NLP) capabilities, enabling users to ask conversational questions of data and get real-time answers.
By combining AI and Generative AI with descriptive, diagnostic, predictive, and prescriptive analytics, companies can realize more value from their data. However, these technologies not only automate current processes but also create new opportunities for innovation and competitive differentiation through smart, self-improving, and autonomous analytics solutions.
Significance of Data Visualization in Data analytics (Right BI Tools and Platforms)
Analytics Maturity Model gives definition to how an organization’s evolution in utilizing data for decisions occurs.
Five stages—Chaotic, Reactive, Defined, Managed, and Optimized—are defined in this model, corresponding to the company’s capability for data management, using analytics solutions, and folding insights into company strategy.
1. Chaotic – Firstly, in this phase, analytics is either absent or extremely unstructured. Organizations are grappling with low-quality data, have no standardized processes, and make decisions based on intuition instead of data. There are no formal analytics tools or professionals, and hence there is inefficiency.
2. Reactive – Secondly, companies start leveraging data but in an ad hoc fashion, usually reacting to short-term issues instead of having a long-term plan. Simple analytics tools might be employed, but data quality is variable, and decision-making is still mostly reactive instead of proactive.
3. Defined – Thirdly in this stage is the formalization of the analytics processes. Standardized methods and reporting tools are implemented to ensure uniform data collection and analysis. Historical data is used in decision-making, and companies begin to align analytics activities with strategy.
4. Managed – Fourthly organizations in this phase leverage sophisticated analytics software and real-time data insights. Processes are defined, and analytics teams operate in close collaboration with business units.
Predictive analytics are introduced, enabling proactive decision-making in line with key performance indicators (KPIs).
5. Optimized – Lastly the most advanced level of analytics maturity, where data is highly integrated into business processes. Machine learning, AI, and automation fuel ongoing optimization, predictive analytics, and prescriptive decision-making. Moreover, organizations at this point have a data-driven culture with close collaboration between business and analytics teams.
Each maturity level in the model represents progress in data quality, process maturity, adoption of technology, level of skill, decision-making, and cooperation.
Organizations advance from one level to the next through enhanced analytics competency, improvement of performance measures, and embedding AI-based insights in decision-making structures.
Summary of Evolution Through Stages
Data has developed substantially over time, changing from mere record-keeping to a strategic tool for decision-making. Initially, organizations made use of manual data collection with little analysis.
As technology developed, structured databases supported rudimentary reporting and descriptive analytics to consolidate past events. The emergence of business intelligence (BI) tools brought in diagnostic analytics, which enabled organizations to realize why events had transpired.
The introduction of predictive analytics gave businesses the capability to project trends and predict future results. Eventually, with the evolution of AI, machine learning, and big data technologies, came prescriptive analytics, which assisted companies in making real-time, data-based decisions based on optimized strategies.
Using the 4 Types of Data Analytics to Drive Informed and Real-Time Decision-Making
Data analytics additionally has evolved to become a major catalyst for business success, allowing businesses to take informed, real-time decisions that improve effectiveness and competitiveness. For example, companies often use descriptive analytics to track trends, diagnostic analytics to detect performance gaps, predictive analytics to forecast risks and opportunities, and prescriptive analytics to suggest best actions.
However, with the appropriate BI tools, AI-driven automation, and real-time data processing, businesses can respond quickly to market fluctuations, enhance operational efficiencies, enhance customer experiences, and accelerate business growth.
How Can A3Logics Help You with Data Analytics Services?
A3Logics is a data analytics consulting company that offers personalized solutions to assist organizations in extracting actionable insights. With experience in big data, AI, ML, and BI tool integration, we help businesses:
- Firstly we create scalable data analytics platforms with strong dashboards and visualization tools.
- Secondly we apply predictive and prescriptive analytics for strategic decision-making.
- Thirdly we maintain high data quality and governance with secure and compliant solutions.
- Fourthly integrate AI-driven automation to accelerate real-time data processing.
- Lastly optimizing existing analytics frameworks to improve operational efficiency and business intelligence.
Whether you need an advanced analytics engine, a BI dashboard, or a machine learning-driven prediction model additionally, A3Logics delivers customized, scalable, and future-ready solutions tailored to your industry needs.
Conclusion – 4 Types of Data Analytics
The evolution of data analytics has empowered businesses to shift from intuition-based decision-making to real-time, data-driven strategies. Moreover by equipping firms with appropriate tools, technologies, and techniques, businesses are able to optimize efficiency, foresee coming trends, and outsmart their competition. A3Logics however empowers firms to unleash the power of data analytics through solutions specifically crafted for enabling wiser, quicker, and more precise decision-making.
With more sectors embracing AI, big data, and automation, those companies with a data-driven mindset will pave the way forward in terms of innovation and business intelligence.
FAQ’s – 4 Types of Data Analytics
Table of Contents


Kamal Kishore
Kamal Kishore crafts innovative digital marketing strategies that drive growth, engagement, and brand success. His expertise in market trends and audience behavior ensures impactful, results-driven campaigns.